
← Research charts & figures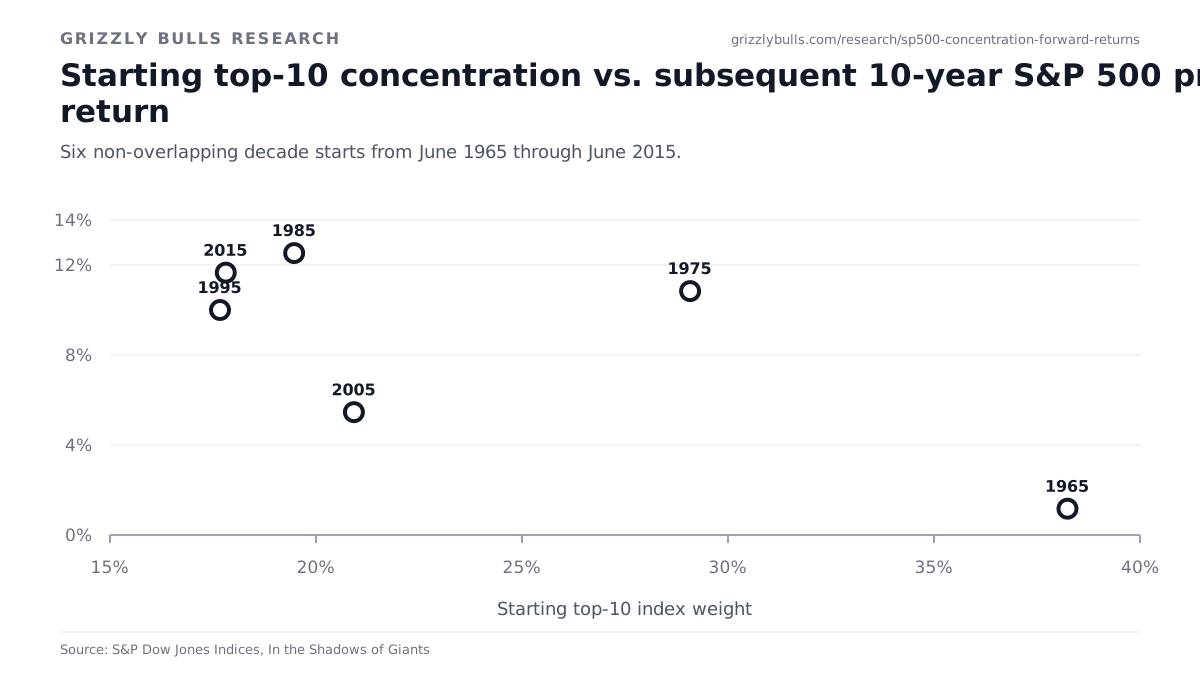
Starting top-10 concentration vs. subsequent 10-year S&P 500 price return
Six non-overlapping decade starts from June 1965 through June 2015.
Published September 21, 2026Data through June 30, 2025X: top-10 index weight; Y: annualized S&P 500 price returnSource study v1.0
Figure provenance
- Canonical study
- S&P 500 Concentration and Forward Returns: Does a Top-Heavy Market Predict the Next Decade?
- Research data date
- June 30, 2025
- Primary evidence
- S&P Dow Jones Indices, In the Shadows of Giants
Cite or embed this figure
The preferred citation points to this stable figure record. The static image embed keeps visible source attribution and uses nofollow links by default.
Preferred citation
Use this when the chart or its underlying finding appears in editorial coverage, research, or analysis.
Lee Bailey. “Starting top-10 concentration vs. subsequent 10-year S&P 500 price return.” Figure from S&P 500 Concentration and Forward Returns: Does a Top-Heavy Market Predict the Next Decade?. Grizzly Bulls, September 21, 2026. Data snapshot June 30, 2025. https://grizzlybulls.com/research/figures/sp500-starting-concentration-next-decade-return
Static image embed
The default embed includes branded source attribution and a nofollow link. Publishers may cite the canonical study separately in their own editorial copy.
<figure>
<a href="https://grizzlybulls.com/research/figures/sp500-starting-concentration-next-decade-return" rel="nofollow">
<img src="https://grizzlybulls.com/research/figures/sp500-starting-concentration-next-decade-return.svg" alt="Scatter plot comparing starting S&P 500 top-10 concentration with the following 10-year annualized S&P 500 price return across six decade starts." loading="lazy" />
</a>
<figcaption>Source: <a href="https://grizzlybulls.com/research/sp500-concentration-forward-returns" rel="nofollow">Grizzly Bulls Research</a></figcaption>
</figure>Read the methodology before interpreting the chart
The full study remains the reference for definitions, denominators, unsupported-inference boundaries, and the exact relationship between Grizzly Bulls analysis and third-party source material.
Open S&P 500 Concentration and Forward Returns: Does a Top-Heavy Market Predict the Next Decade? →