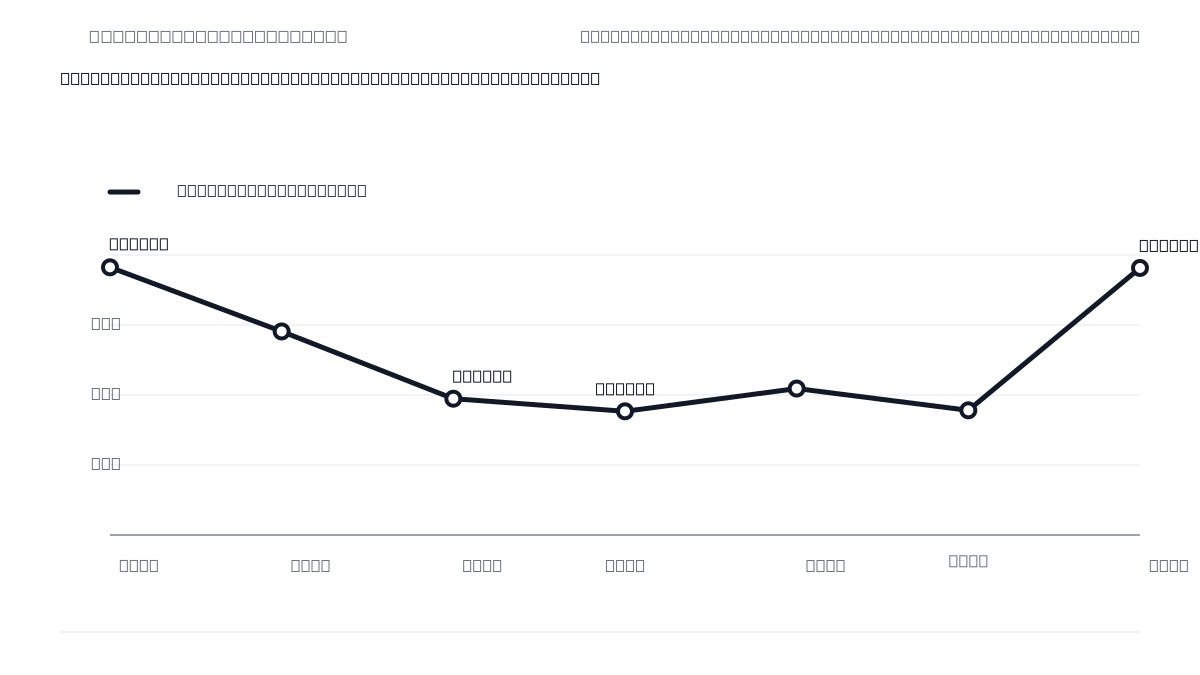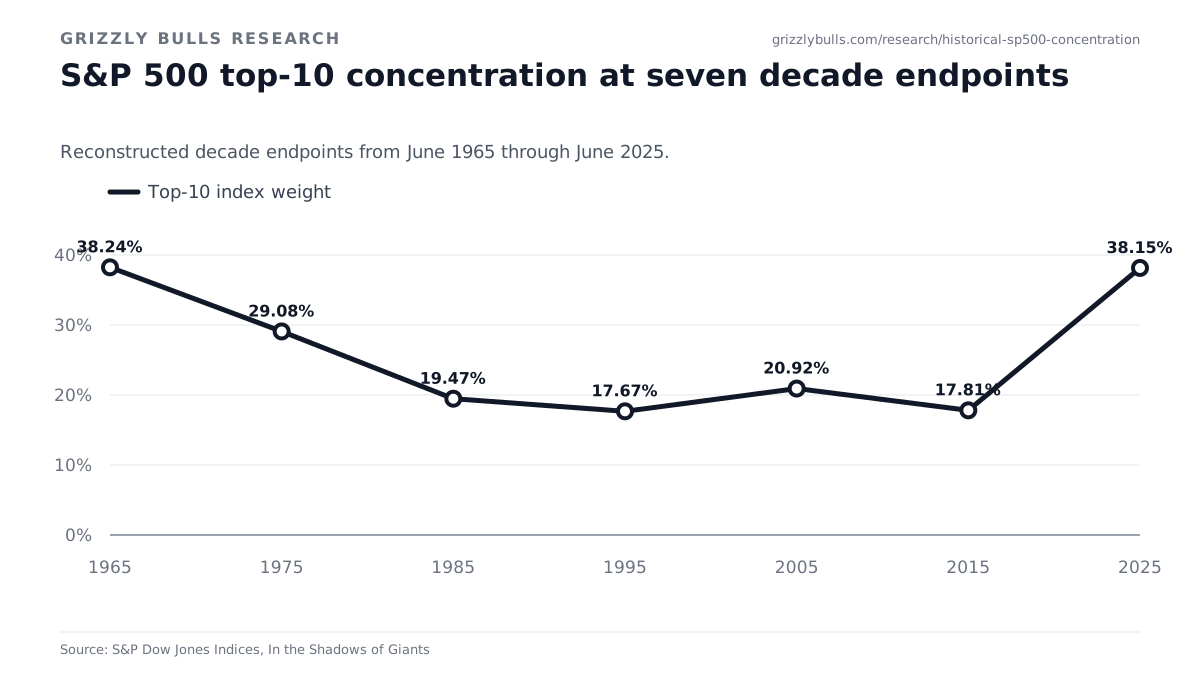
S&P 500 top-10 concentration at seven decade endpoints
Reconstructed decade endpoints from June 1965 through June 2025.
Download SVG for scalable editorial graphics or PNG for presentations and social publishing. Every figure points back to the full study for methodology, limitations, and source context. Static embed code uses nofollow attribution by default.
Reconstructed decade endpoints from June 1965 through June 2025.
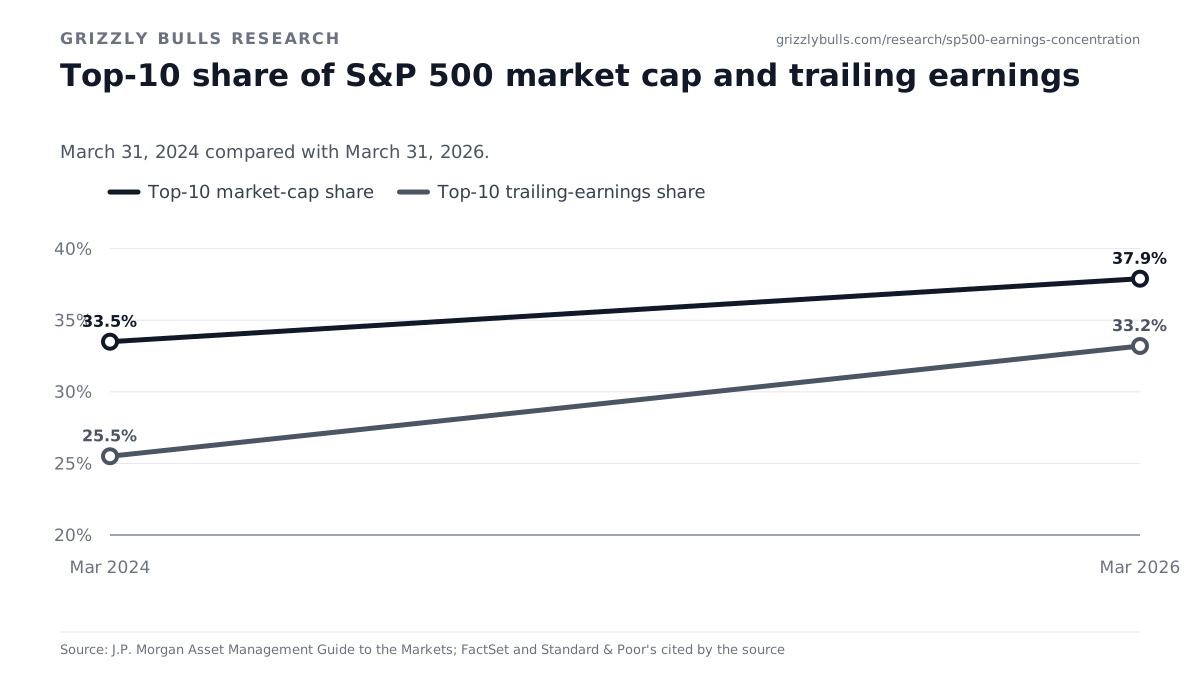
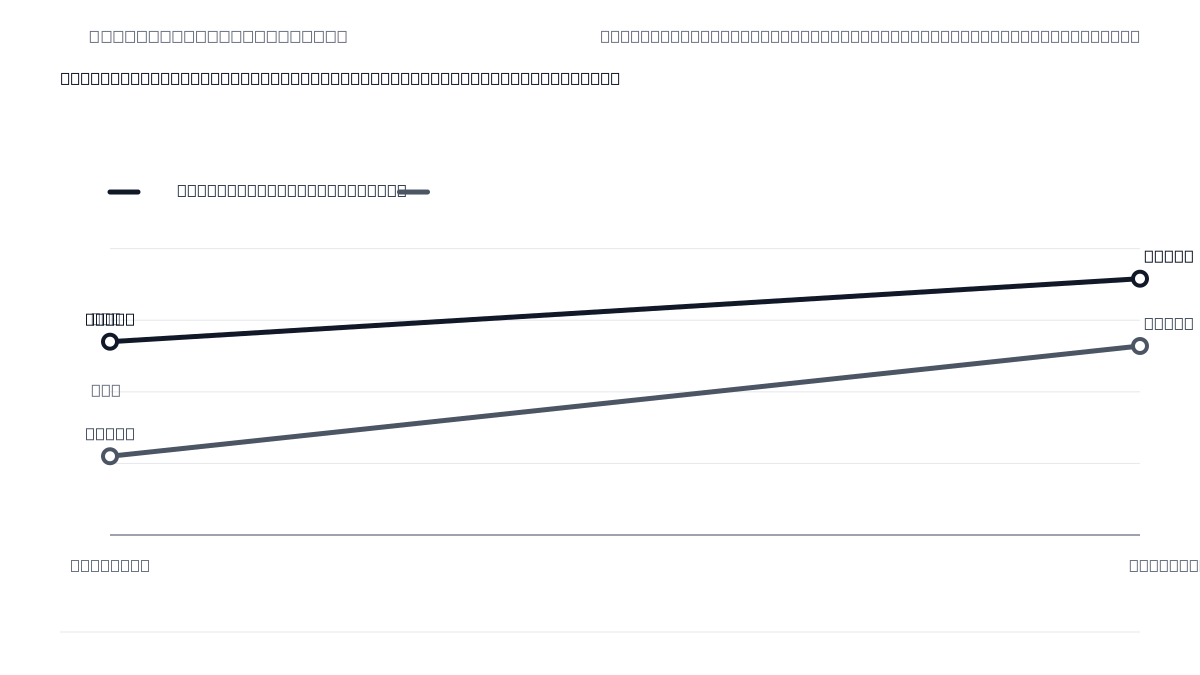
March 31, 2024 compared with March 31, 2026.
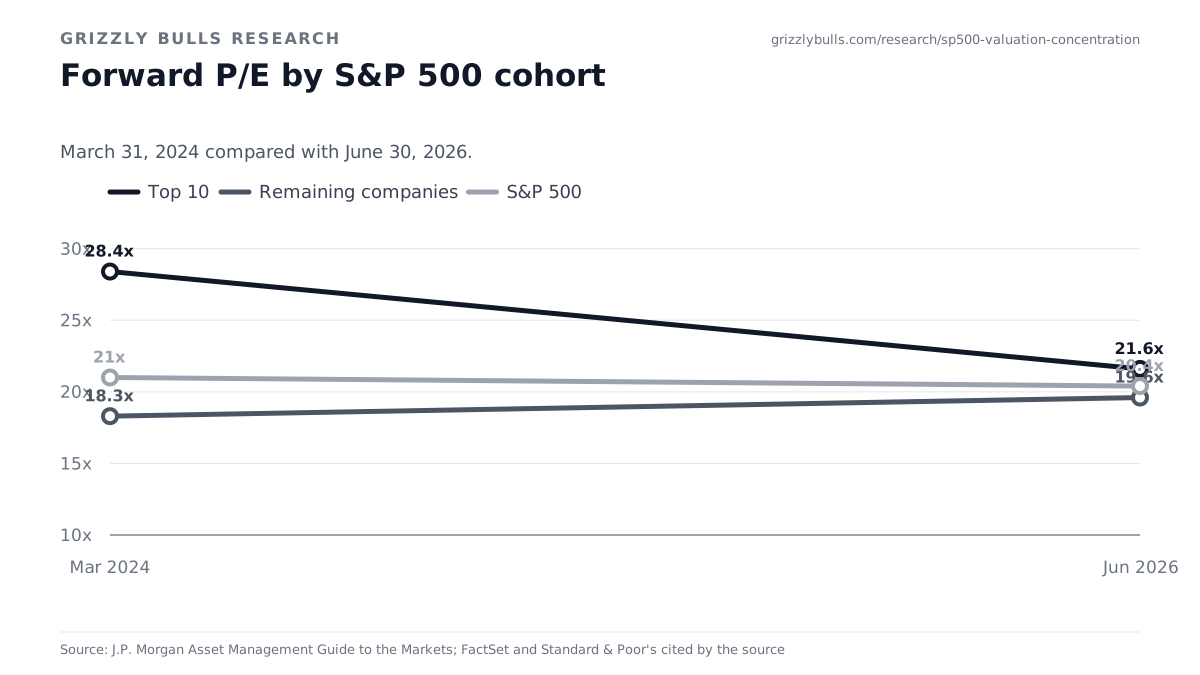
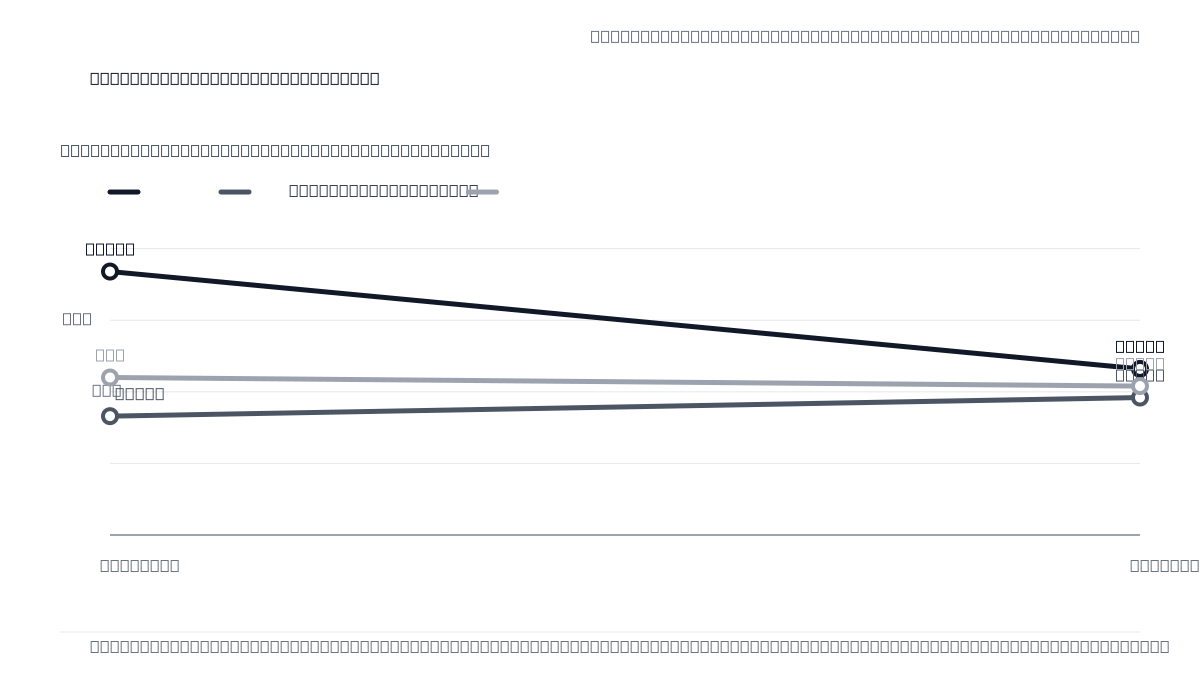
March 31, 2024 compared with June 30, 2026.
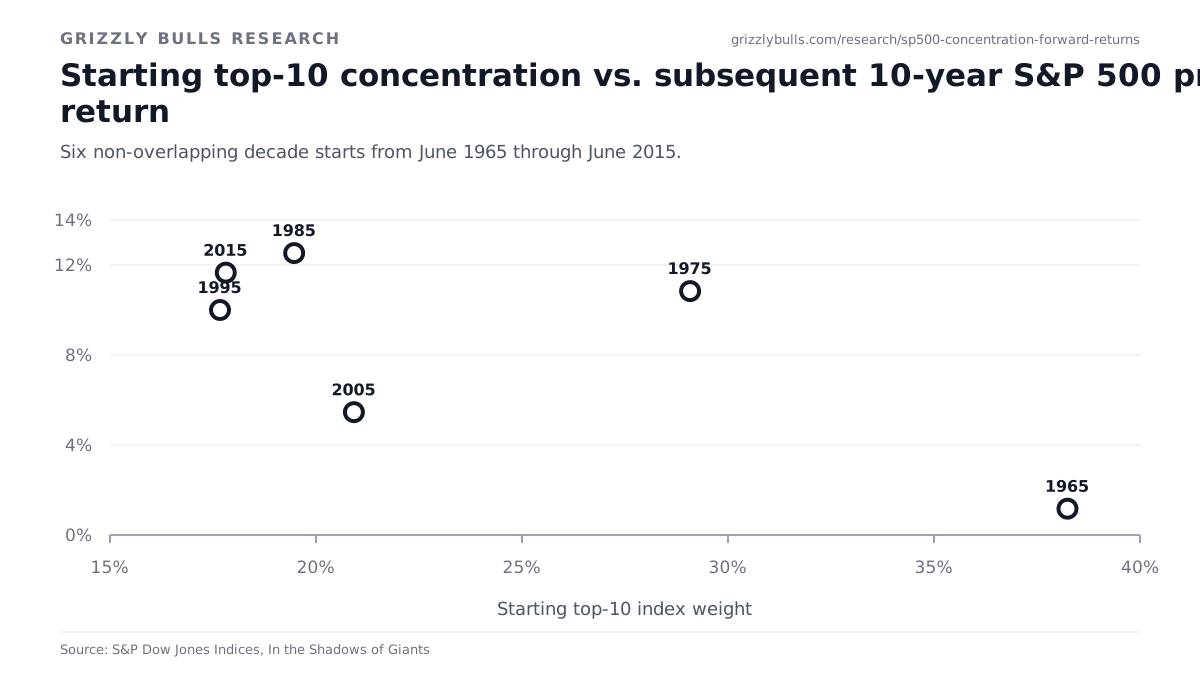
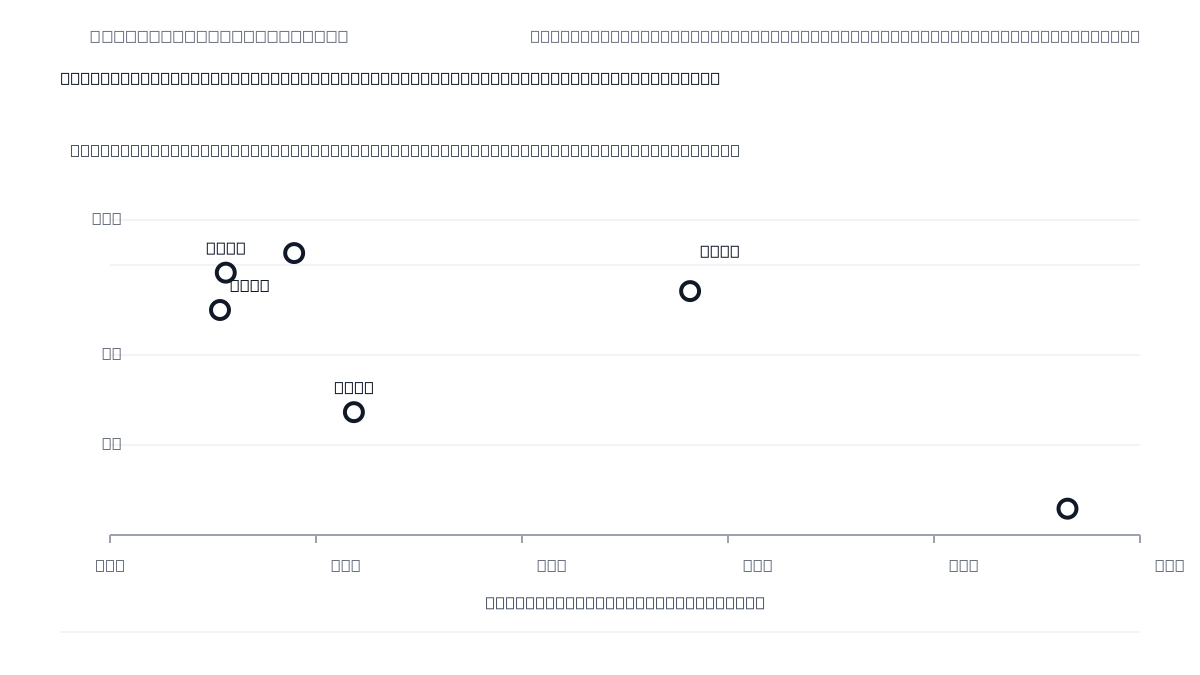
Six non-overlapping decade starts from June 1965 through June 2015.
Each figure has a permanent landing page plus direct SVG and PNG asset URLs so citations and embeds do not depend on a screenshot filename.
The figure page keeps the data date, source study, third-party evidence label, and preferred citation together.
Publishers can cite the canonical study naturally in their own coverage. Reuse does not require a followed backlink.
Generated image embeds use a nofollow attribution link by default and keep visible Grizzly Bulls branding inside the asset.